Antigen processing and presentation are processes that
occur within a cell that result in fragmentation (proteolysis) of
proteins, association of the fragments with MHC molecules, and
expression of the peptide-MHC molecules at the cell surface where they
can be recognized by the T cell receptor on a T cell. This lead to the
stimulation of CTL cells to clear the infection.The three major step
where we can devise rules
The 20S proteaosme is the key enzyme
for degradation of most of cytosolic and nuclear protein found in all
living cell from the eukaryotes to prokaryotes. The proteasome mostly
degrade the ubiqtinated and non-ubiqtinated proteins. The cleavage
specificity of proteasome is believed to be an important factor in
antigen processing because the MHC class I epitopes must conform to
stringent structural requirement of both length and composition for
efficient presentation.
The 20S proteasome is consist of 28
subunits into four heptameric rings (alpha7-beta7--beta7-alpha7 ). The
two inner beta subunits have three active sites for making cleavage
whereas a subunits create environment for making cleavage. These active
sites have distinct but overlapping cleavage specificity. The different
active sites of the proteasome are associated with chymotrypysin like
(i.e. cleavage after basic residues), Trypsin like (i.e. cleavage after
large hydrophobic residues) and peptidyl-glutamyl-peptide-hydrolyzing
activity (i.e. cleavage after acidic amino acids). The experimentally
identified proteasome cleavages patterns are therefore represent a
mixture of cleavages carried out by different active sites or subunits.
This makes the modeling of proteasomal cleavage a complex task.
In the past, digestion of synthetic
peptides or proteins and through analysis of degraded products provided
more insight into cleavage specificity. The analysis of fragment
generated by constitutive proteasome provide better understanding into
P1 (the position that lies at N terminal of cleavage site. and P1'
(position that lies at C terminal of cleavage site). More amount of data
about the cleavage products of proteasome are generated by the invitro
digestion of complete proteins like enolase and b-casein. The increase
amount of data made it possible to derive rules for devising
computational methods for modeling the proteasomal cleavage specificity.
At the moment, three methods (PAProc MAPPP and NetChop) are available on the worldwide
web for prediction of proteasomal cleavage sites from the proteins.
PAProC:
is a method for predicting human and yeast (wild and
mutated type) cleavage sites based on the in vitro digestion data of
enolase I. The quantitative effect of different residues on cleave
specificity is considered using hill climbing algorithm.
MAPPP: is a linear method for the prediction of 20S proteasomal
cleavage sites. The method is based on the "cleavage determining amino
acid motifs". The method was further improved by developing kinetic
model of 20S proteasome, which took in consideration the time
dependent degradation of peptides.
NetChop: is recently published best
method for predicting the constitutive or immunoproteasome cleavage
sites on the basis of multilayered artificial neural network. The
method is based on the invitro digestion data and sequence signal from
the boundaries of naturally processed MHC class I ligands. The latter
was included on the basis of assumption that proteasome cleavage sites
mostly lies at the C terminal of MHC class I ligands.
In this study a,
systematic attempt have been made to improve these predictions for
constitutive proteasome (20S proteasome) by using various machine
learning tools. In order to develop a highly accurate method for
proteasome cleavage prediction, we have applied commonly used
techniques i.e. Support Vector Machines, Parallel Exemplar Based
Learning (PEBLS) and weka (Waikato Environment for Knowledge analysis)
on in vitro digestion data. The SVM based method outperformed the
machine learning techniques used in this study as well all the
exiting prediction methods. The MCC of SVM based prediction method is
0.43. The performance of the method was evaluated through five set
cross-validation as well on an independent dataset.
Detailed Stepwise Help
Sample of Sequence Submission Form-:
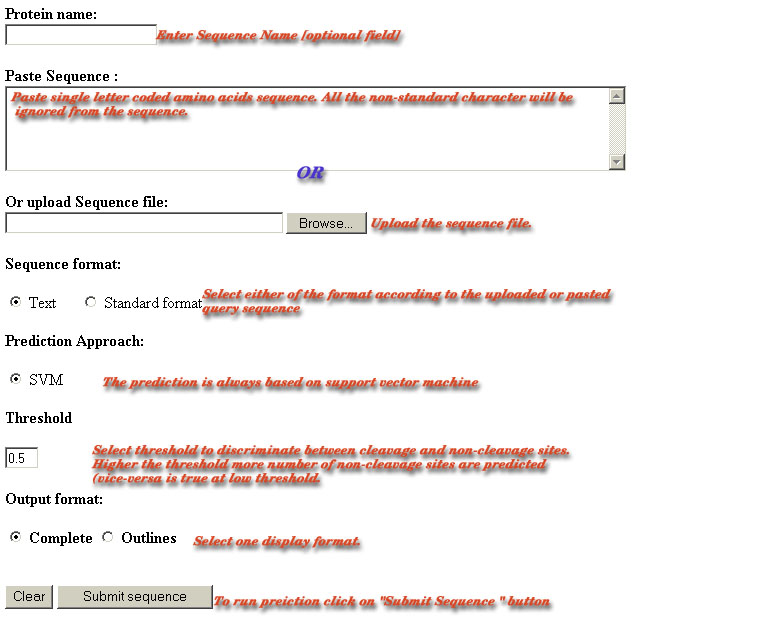
Name of Protein-:
The name of sequence may have letters and
number with the "-" or "_". All other character are non-permissible.
If the name of the sequence is submitted with illegal characters then
warning will appear ( sorry,sequence have some illegal characters).
The field is assigned a default name "Protein". The sequence name is
just used for only your information. It may be a problem with ä, ö, ü
for example or an empty space within the name of the sequence, which
is not allowed for reasons of security.
Sequence submission:
This server allows the submission of sequence
in any of the standard formats. The user can paste plain sequence in
the provided text area.The server also has the facility for uploading
the local sequence files. Amino acid sequences must be entered in the
one-letter code.All the non standard characters like
[*&^%$@#!()_+~=;'",<>?.\|} are ignored from the sequence.The
minimum length of the submitted sequence should be 10 otherwise server
will show prediction have which may be wrong interpetaion.The warning
is also displayed if the user submitted sequences from both sources.
Format of Antigenic
sequence-: The server can accept both the
formatted or unformatted raw antigenic sequences.The server uses
ReadSeq routine to parse the input.The user should choose wether the
sequence uploaded or pasted is plain or formatted before running
prediction.The results of the prediction will be wrong if the format
choosen is wrong.
Prediction
Approaches-:In Vitro Digestion Data This SVM classifier can predict the proteasomal cleavage sites with constitutive proteasome cleavage specificity.The classifiers for prediction of constitutive proteasome cleavag
e sites were trained and tested on yeast enolase I and b-casein digestion data obtained from the work of Toes et al., 2001 and Emmerich et al., 2000, respectively.
Prediction
Approaches-:MHC Ligand Data This SVM classifier can predict the cleavage sites with constitutive and immuno- proteasome cleavage sites with cleavage specificity.The natural MHC class I ligands or T cell epitopes were con
sidered to have cleavage site at their C terminal rest of the positions between N- and C- terminal have minor or no cleavage sites.
Threshold-:
The threshold is used to
discriminate the cleavage and non-cleavage sites.The user can vary the
threshold score between the -1.5 to 1.5. The residues achieving score
more then the cutoff score are predicted as P1 cleavage site otherwise
they are predicted as non-cleavage site.if the user did not select
threshold then the default threshold of prediction methods will be
used.The default threshold is that at which the maximum MCC of
prediction method is achieved. The default threshold for in vitro digested data based and MHC ligands based classifiers is "-0.1" and "0.3" respectively. The higher the threshold (= high stringency), the lower the false positive rate and the hi
gher the false negative rate. in contrast the low the threshold (= low stringency), the higher the false positive rate and the lower the false negative rate. In short, from the same protein sequence input, a threshold setting of 1.0 will predict a lower
number of cleavage sites (cleavage sites with high score), compared to 0.0 or lesser thresholds.
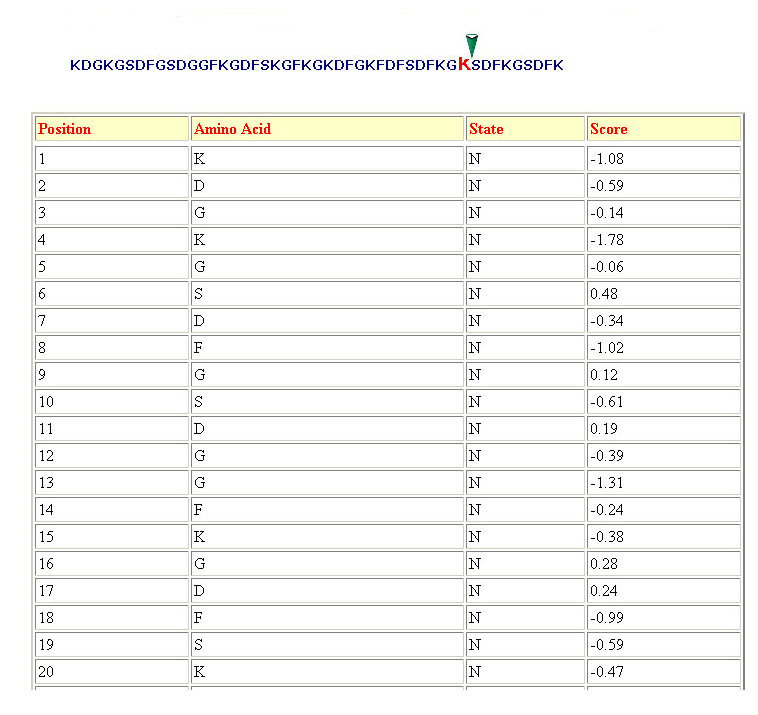
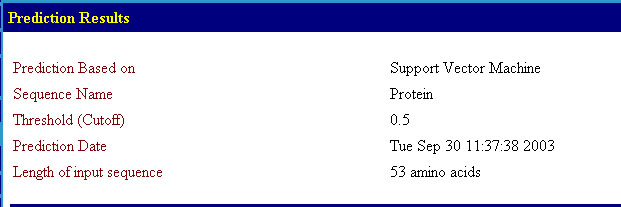
Prediction Results-:
The results of the prediction displayed in
user-friendly text formats.Each of result display format firstly
provides a comprehensive account of length of input sequence, prediction
approach, selected classifier and cutoff threshold as shown below. The result
of prediction will be displayed in these two formats.
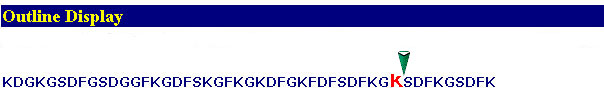
-
Outlines Display
-
Complete Display